STEP 5 / 6
Analog score
Weighted matches added up for every 90 m cell
How we did it
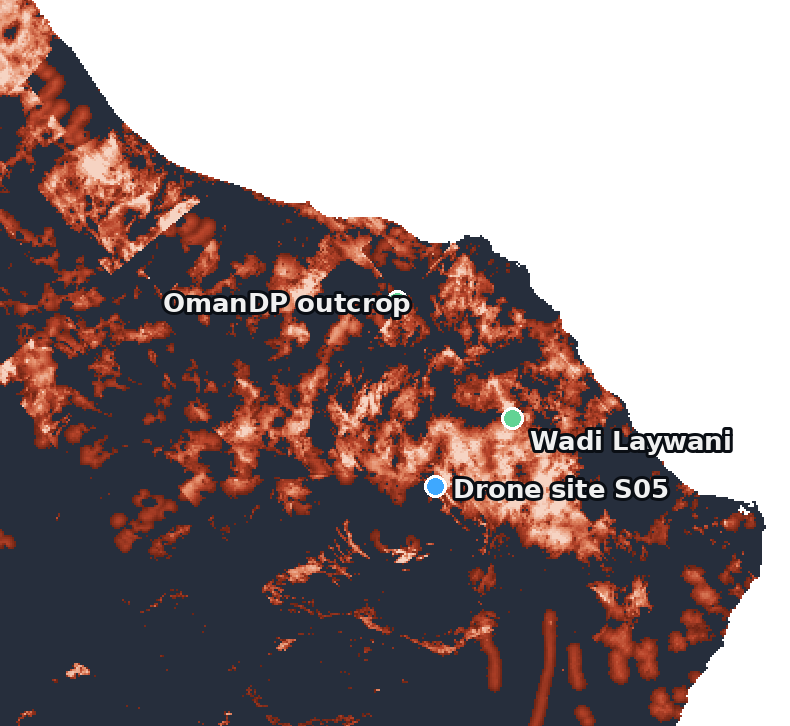
One score per cell
Score = Σ weight × match
38 million cells, 4 missions. The brightest places are Oman’s best twins — along the ophiolite.
NASA Space Apps 2026 · Al Bidiyah, Oman
Oman Analog Atlas
Luqman · Drone & team lead
Adil · GIS analysis
Mazin · Web platform development
Why we are called UBAR
NASA satellite data lead to finding Ubar
UBAR uses NASA data again: to find Oman’s Moon and Mars analogs
The challenge · NASA Space Apps 2026
Atacama, Haughton, Death Valley: used for tests, but not well characterized.
Every site copies some things and fails others. Which ones?
NASA asks for a global, systematic search for new, unrecognized analogs.
Our solution
STEP 1 / 6
Moon, Mars and Oman measured from orbit
How we did it
| Source | What it measures |
|---|---|
| LRO · LOLA | Moon terrain, 80 m |
| MGS · MOLA | Mars terrain, 463 m |
| Copernicus DEM | Oman terrain, 90 m |
| Terra/Aqua · MODIS | Day–night heat, plant cover |
| ISS · EMIT | Surface minerals |
| NASA POWER | Wind |
| OpenStreetMap | Roads and villages |
STEP 2 / 6
Everything an analog must match, mapped across Oman
How we did it
Slope · Roughness · Relief
Day–night ΔT · Yearly ΔT · Wind
Plant cover · Old riverbeds
Minerals (EMIT)
Access, away from villages
STEP 3 / 6
Each Oman cell vs the real landing site → match 0–100%
How we did it
Target: Jezero floor, 1.5° slope
Close → near 100%
Far → near 0%
Targets are measured on the real Moon and Mars sites, at the same scale as Oman.
STEP 4 / 6
Experts decide what matters most for each mission
How we did it
STEP 5 / 6
Weighted matches added up for every 90 m cell
How we did it
Score = Σ weight × match
38 million cells, 4 missions. The brightest places are Oman’s best twins — along the ophiolite.
STEP 6 / 6
Known analogs, Utah MDRS and a drone flight
How we did it
How much of Oman each site beats · Mars science score
OmanDP outcropOman Drilling Project
97.5%
Utah MDRSMars Society · scored blind
88.8%
Real targets, real terrain
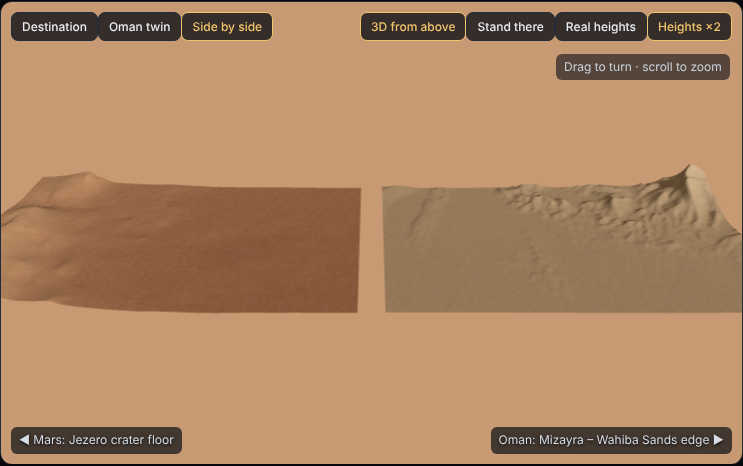
Jezero floor, where Perseverance landed · slope 1.5°, relief 33 m per km
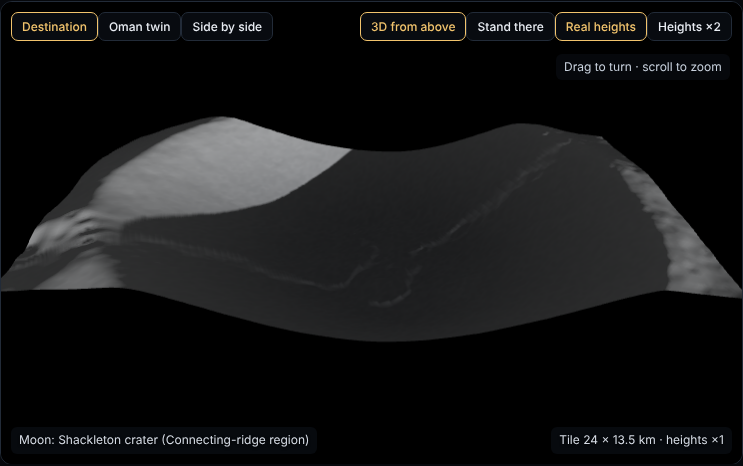
Shackleton crater, lunar south pole · 4 km deep walls. Oman can’t copy it, and the site says so.
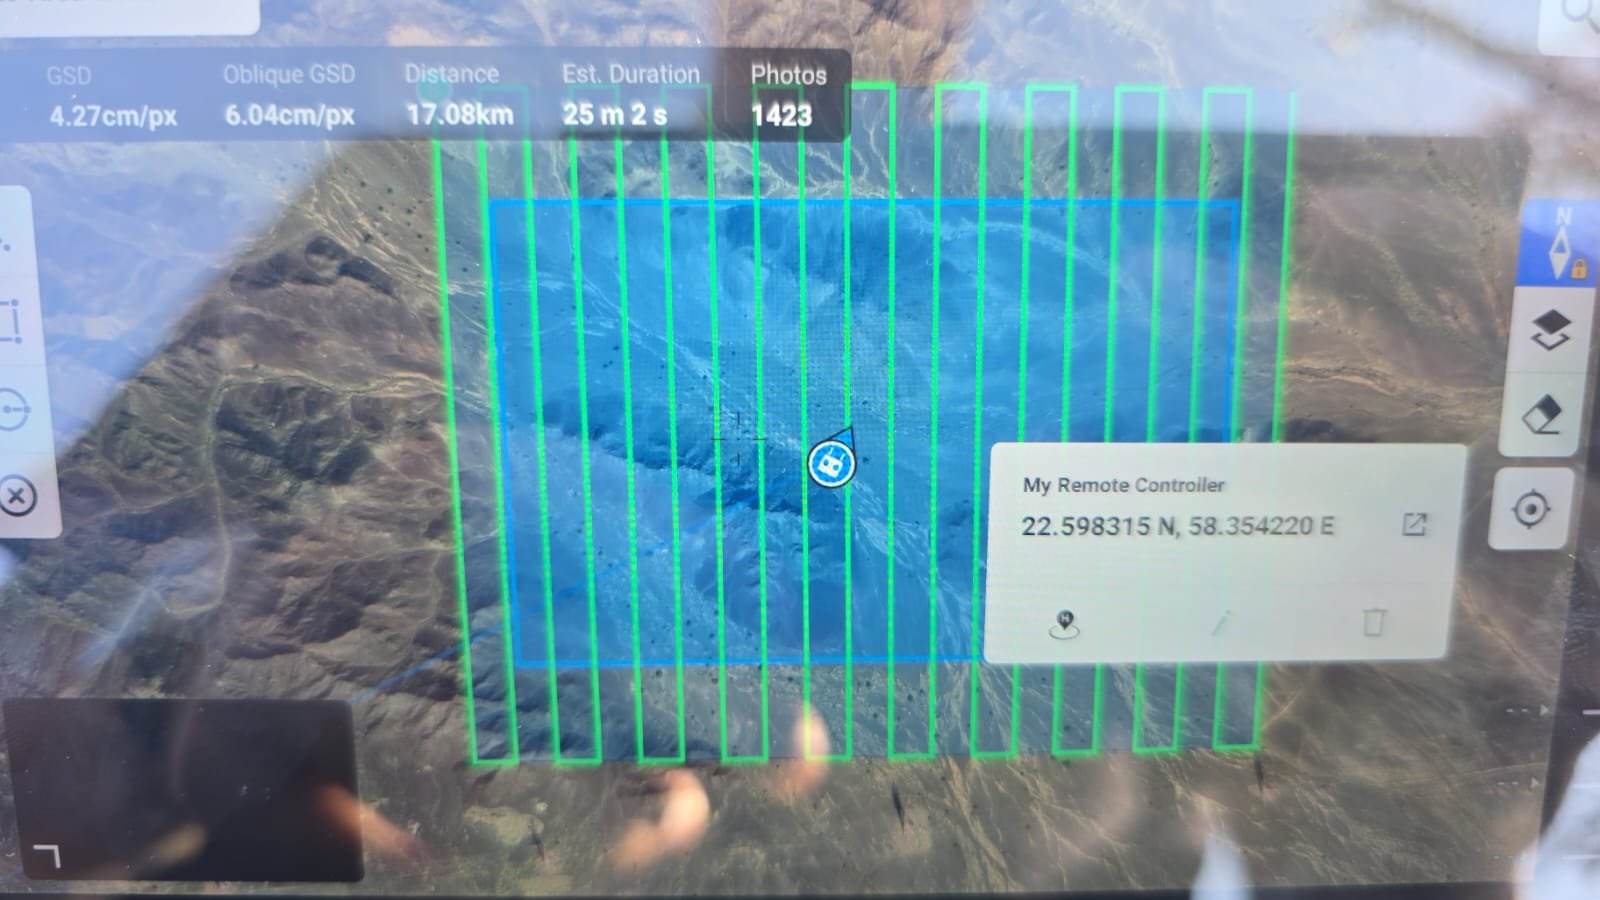
Field check · 15 Nov
Satellite prediction at S05 · click a card to reveal what we found
0.47 km² · 1,423 photos · 4.3 cm per pixel
Impact
Pick a Moon or Mars landing site and see Oman’s best rehearsal grounds in seconds, with the reason behind every score
A ready-made shortlist for Oman’s next Mars simulation after AMADEE-18, starting with a site our drone has already surveyed
Students stand on Mars in VR, then discover the Omani valley that looks just like it, and learn why